
Key performance indicators (KPIs): How to set the right metrics for your business
What gets measured gets managed. It’s a common saying, and for good reason. Data is crucial in today’s business world—the key to everything from growing sales and profits to implementing a business strategy, retaining employees and increasing operational efficiency.
But many businesses fail to use suitable key performance indicators (KPIs) and monitor them properly with dashboards. This can leave companies at risk—in the dark about critical problems and unable to respond to challenges or set goals.
Ill-considered KPIs can even create serious operational issues that disrupt the entire business.
It’s really about data. In the 21st century, data should be driving your decisions.
Josh Ramsbottom
Senior Business Advisor, BDC Advisory Services
Operational efficiency expert Josh Ramsbottom is a big believer in the virtues of well-designed KPIs and dashboards. “The right data can be used to improve productivity, understand and pursue opportunities, and build transparency, team alignment and engagement,” says Ramsbottom, a Senior Business Advisor with BDC’s Advisory Services who specializes in coaching businesses on operational efficiency.
“It’s really about data. In the 21st century, data should be driving your decisions. It’s not about emotions anymore,” he says.
The wrong KPIs can hurt a business
Ramsbottom gives an example of the power of KPIs to help or damage a business. He worked with a company that was having trouble with poor on-time delivery and couldn’t figure out why. The culprit turned out to be a poorly thought-out KPI.
The company was giving employees a cash bonus each day if they hit their production target.
The problem: The defect rate was through the roof, which meant many products had to be reworked, leading to delays.
The KPI was also causing employees to prioritize production of items that were quickest to make, not those needed for delivery.
“They had lost control of scheduling, production planning and quality control because the KPI was driving the wrong behaviour,” Ramsbottom says.
Changing KPIs to focus on quality control and timely delivery led to major benefits for the company:
- reduced defect rates, inventory costs and real estate needs for scrap and work in progress
- improved productivity, cash flow and profitability
- better employee engagement and customer satisfaction
- less clutter in the facility
The benefits can be very significant when companies adopt appropriate KPIs.
What is the purpose of KPIs?
KPIs serve three major purposes:
1. Gauging and improving performance—KPIs let the business owner, efficiency supervisors and other employees understand the company’s performance and productivity. You can compare data to industry benchmarks, analyze it to identify gaps and opportunities to improve, and monitor trends and progress toward objectives, such as those in your strategic plan or an operational efficiency project.
2. Ensuring stable operations—A second major purpose is to ensure systems, processes and teams are operating at a stable rate. “KPIs are like a speedometer in your car,” Ramsbottom says. “If I see my speed fluctuates greatly, something is probably wrong with my vehicle or driving. A KPI tells me everything is running smoothly.”
3. Incentivizing your team—KPIs also let you incentivize and reward your team in a fair, non-emotional way that eliminates favoritism and moves the business toward its objectives. “How do you say somebody did an amazing job if you can’t tell them how well they did the job or what your expectations were?” Ramsbottom asks.
“Businesses are increasingly using KPIs for HR because they align with the expectations of the millennial workforce and help address today’s labour shortages.”
KPIs are not the same as milestones
Keep in mind that KPIs are not the same as milestones. The latter are events marking progress toward completion of business initiatives. They’re often used in planning documents, but shouldn’t be confused with KPIs, which are based on data.
4 steps to select the right KPIs
Ramsbottom uses four steps to help businesses design and use KPIs.
1. Review current metrics
The first step is to look at what KPIs, if any, you currently use to measure your business. Companies usually keep an eye on some basic data, such as annual financial statements or client feedback.
But many businesses neglect to develop more sophisticated data as they grow. “When companies are small, it’s easy to have a direct line of sight to sales or production and gauge instinctively whether the business is okay or struggling,” Ramsbottom says.
“But as companies grow and mature, that line of sight usually gets obscured. Starting on a KPI journey is about figuring out what you need to know to proactively make the appropriate decisions at every level of the business, and not reactively wait until month-end or year-end statements, which are lagging indicators.”
Starting on a KPI journey is about figuring out what you need to know to proactively make the appropriate decisions at every level of the business.
2. Understand your goals
The next step is to review your business objectives. This is a key step when choosing the right KPIs. “We need to know where we’re going if we want to develop a plan to get there,” Ramsbottom says.
“Once we understand the goals, we can look at all areas of the business and ask how each department or unit influences that target.”
You can use a Gemba walk and lean principles to identify challenges in your company. Root cause analysis and Pareto analysis can help you locate the key underlying causes of problems, while structured problem-solving or a Kaizen blitz are useful for developing solutions.
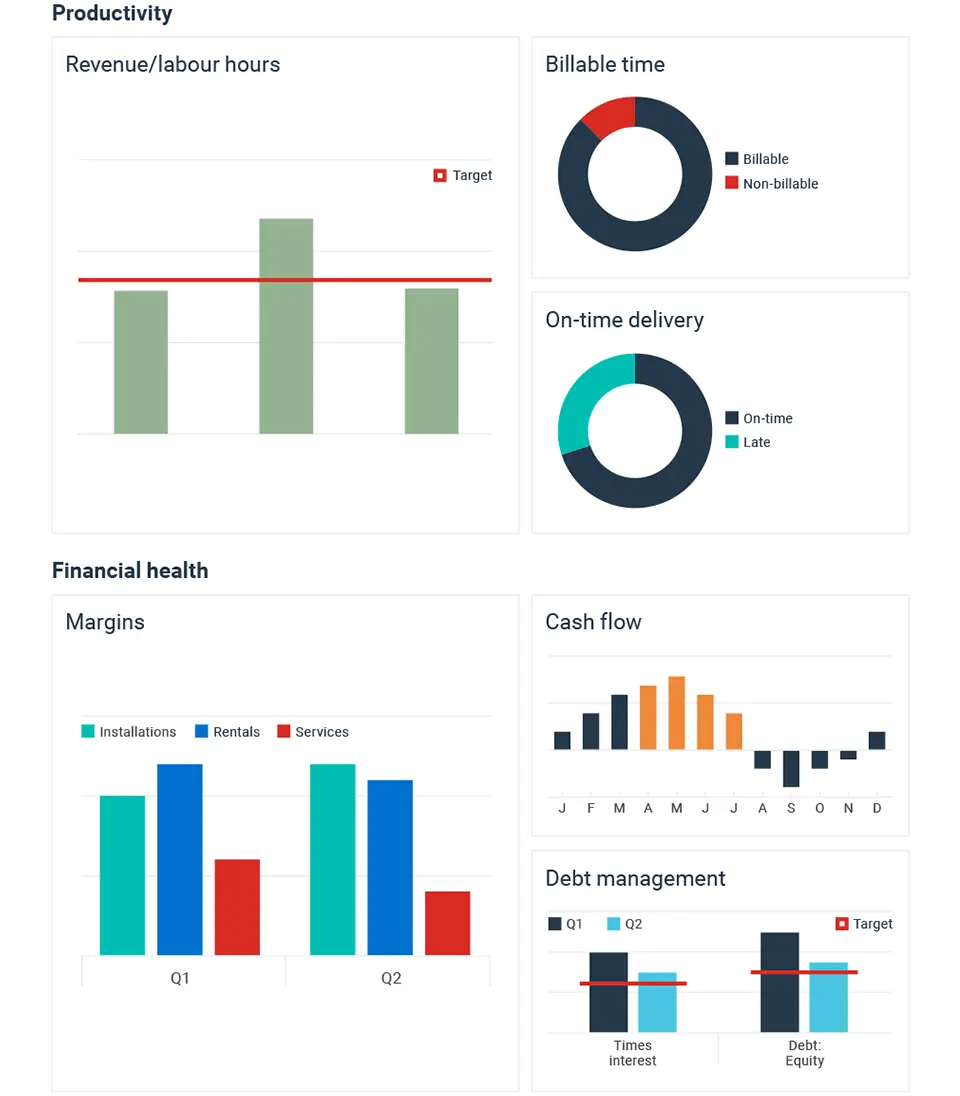
Example of a business dashboard
3. Set appropriate KPIs
Now you’re ready to choose KPIs for various areas of the business and the company as a whole.
Three elements that make up good KPIs
KPIs should be:
i. Targeted
Set different KPIs at various levels of the business that drive employees toward your broader objectives. “If you want to increase the company’s overall sales, the sales team needs KPIs that support that bigger number,” Ramsbottom says (see below for sales KPI examples).
KPIs should also be related to activities that employees can influence. “You can’t reward or judge a team for an activity they can’t control,” Ramsbottom says.
Be aware of how KPIs may incentivize activities that affect other functions. For example, if you incentivize your sales team to sell more, make sure your production department can handle increased orders.
ii. Practical
Collecting the data should be easy and quick. Ideally, it should be automated. “You don’t want to have to crawl under a machine every hour and collect 17 different numbers, then multiply them in a complex formula,” Ramsbottom says.
iii. Sufficient
You need enough indicators at each level of the business, but not too many. “A common mistake when businesses start doing KPIs is they try to do too many,” Ramsbottom says. “Or they try to find a single KPI for the whole company.”
Examples of common business KPIs
Here are some commonly used KPIs for different business areas and objectives:
Financial performance
- Revenue growth
- Net and gross profit margins
- Margin by product line
- Cash on hand
- Cash conversion cycle
- Inventory turnover
- EBITDA
- Value created by each employee
Operations and distribution
- Defect rate
- Return rate
- Customer complaint rate
- Machine and employee downtimes
- Capacity utilization
- Throughput
- First pass yield
- Scrap rate
- Time from order to final delivery
- On-time delivery rate
- Accident and reportable incident rates
- Other waste-related metrics
- Number of innovation ideas proposed by employees
- Revenue from innovations
Sales
- Conversion rate
- Number of new contracts per period
- Average value of new contracts
- Number of sales calls
Marketing
- Marketing return on investment
- Website and social media traffic
- Social media conversion rate
- Search engine keyword ranking
- Average website session duration
Human resources
- Employee turnover
- Employee satisfaction and engagement
- Absenteeism rate
- Training hours
- Diversity representation, hiring, retention, promotion and compensation rates
4. Display KPIs to your team
With the right KPIs in hand, it’s important for your team to see them and regularly talk about them. Dashboards are key for this.
You can create personalized dashboards that each employee can see on their company portal showing relevant KPIs. You can also put dashboards on monitors or digital displays around the business that show metrics applicable to different departments and the overall company.
With Industry 4.0 or smart manufacturing technology, you can automate data collection, analysis and display directly from equipment.
What makes a good dashboard?
Dashboards should be:
- Updated often so they stay relevant.
- Clear and simple so your team can see the KPIs at a glance and easily understand the data and trends.
- Reviewed regularly to ensure they incentivize the activities you want.
- Used as a focal point to inspire and guide conversations at meetings and team huddles. You can also include the data in regular KPI reports. “Be sure to put the data where employees will see it and talk about it so it drives behaviour to your goals,” Ramsbottom says.
Want to take the next step to boost your productivity? Read our free guide to learn more about the basics of operational efficiency or fill out a form to start talking with one of our experts.