
VC in Canada: How do we stack up against the rest of the world?
Building a start-up is hard. As Canada’s most active VC investor, BDC Capital works diligently to try and alleviate some of that pressure. But how do we measure success? And how do we know if our work is effective?
Canadian entrepreneurs, for example, will tend to say that there are not enough VC dollars in Canada. Intuitively, this makes sense. It seems like a Canadian start-up would probably have an easier time raising capital in the U.S., given the abundance of VC south of the border.
On the other hand, Canadian VCs will tell us that there are not enough fast-growing start-ups that make a VC investment worthwhile in Canada. Can you think of a rapidly growing Canadian start-up that has not been able to raise capital recently? We cannot.
In this series of blog posts, I’ll be sharing some of the insights we’ve discovered while trying to answer these questions. I hope to ask further questions that will help us continue building a world-class VC ecosystem.
This study was conducted prior to the onset of COVID-19 and these results do not take account of the changes to the ecosystem brought about by the crisis. We believe the results of the analysis are still relevant in the current environment. Notably, they shed light on the strengths and weaknesses of the Canadian VC ecosystem, which could inform future policy to create a more competitive ecosystem in the recovery.
Comparing Canadian VC performance to the world
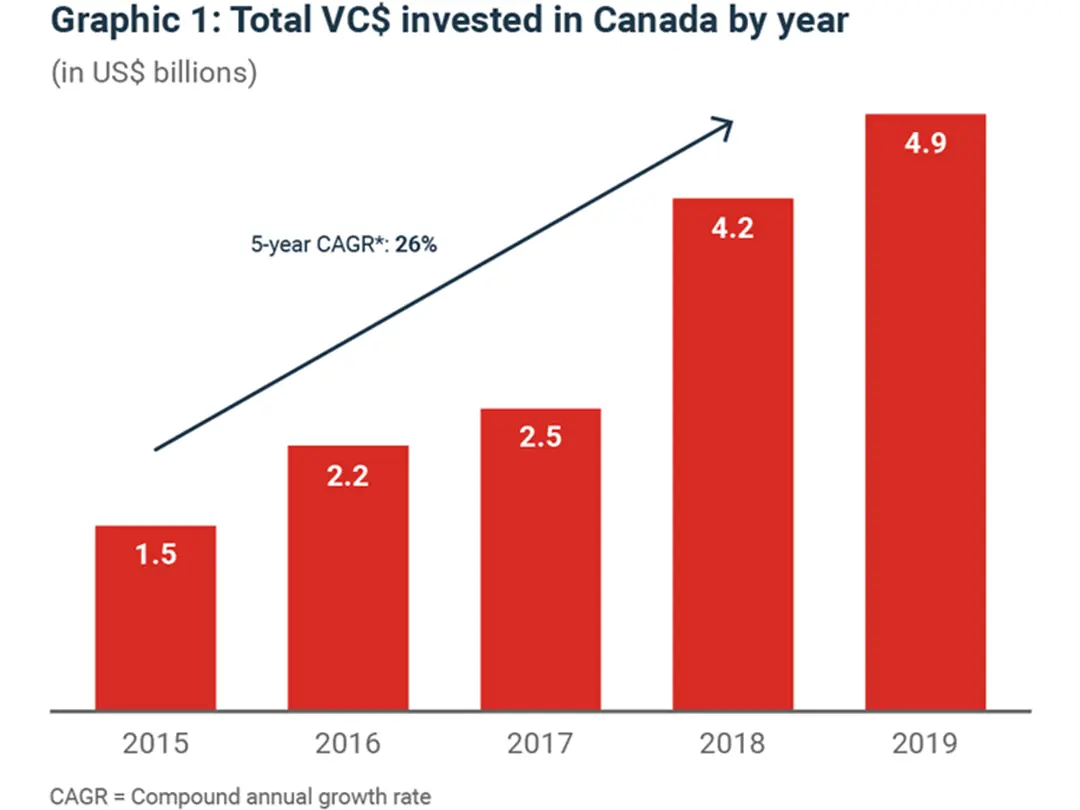
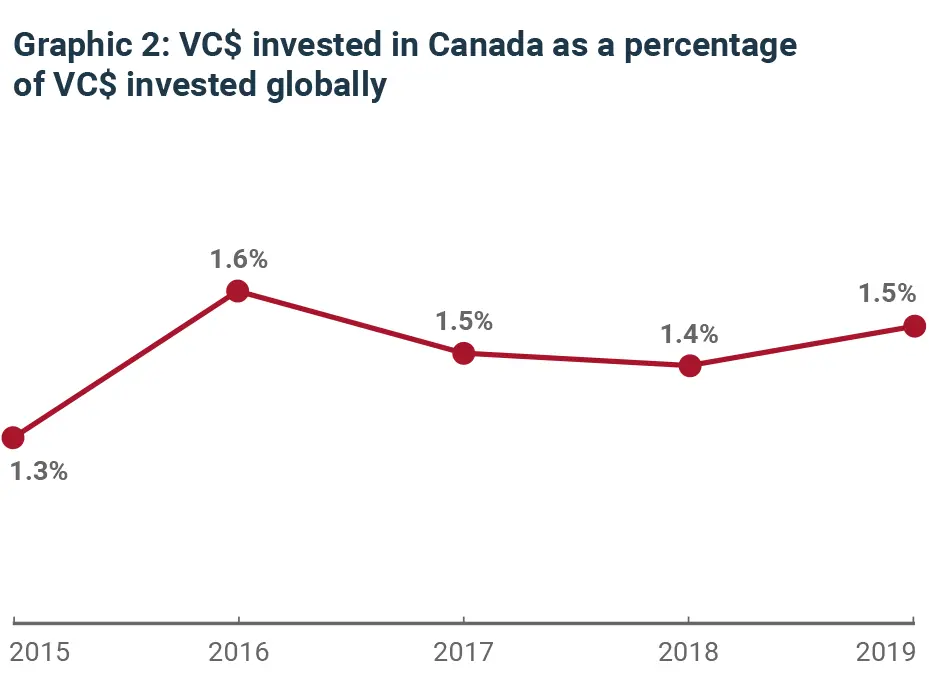
The first thing we did was look at how the Canadian venture ecosystem performs relative to other major ecosystems. For example, we are very proud of how Canadian VC has reached record levels of investment in 2019 (Graphic 1), yet we also understand that it is largely a byproduct of the increasing amount of VC dollars in the global ecosystem (Graphic 2).
To get a true picture of Canada’s performance relative to others, we need to dig deeper into the data. Also, because it takes a long time to build a company from the ground up into a large enterprise, we need a 10- or 20-year view on our ecosystem’s performance.1
Graphic 3 looks at the percentage of companies in each country founded over the last 20 years that have grown to be valued above US$250M (for the purpose of this analysis, let’s call them “success stories2”).
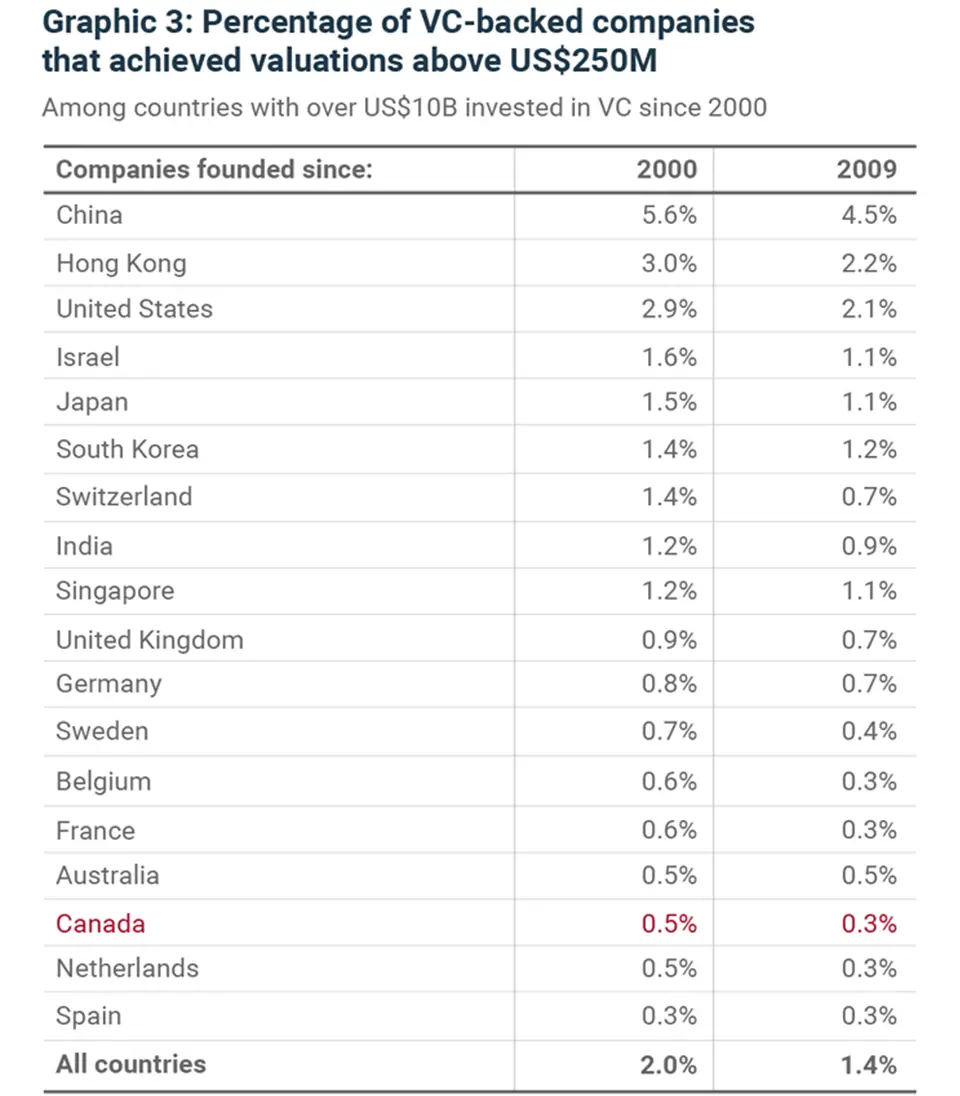
For all companies founded since 2000, Canada ranks low on the list at 0.5%, whereas the U.S. is at 2.9%. In other words, if you were to have founded a VC-backed business in Canada over the last 20 years, there is a 0.5% chance you would have achieved a valuation above US$250M. Your chances would have been multiplied by six if you had founded your company in the U.S., and by three in Israel.
We repeated the analysis for all companies founded over the last 10 years and found no meaningful differences in the results.
If you are a Canadian entrepreneur, do not let these numbers discourage you. As we will explain in later blog posts, your company may strongly benefit from being based in Canada.
Is the Canadian VC ecosystem efficient?
The next thing we did was measure the efficiency of our VC ecosystem (Graphic 4). If we assume that a VC ecosystem is a machine that produces start-ups, we can evaluate the efficiency of these machines by comparing how much VC dollars we need to pump into the ecosystem to create a success story.
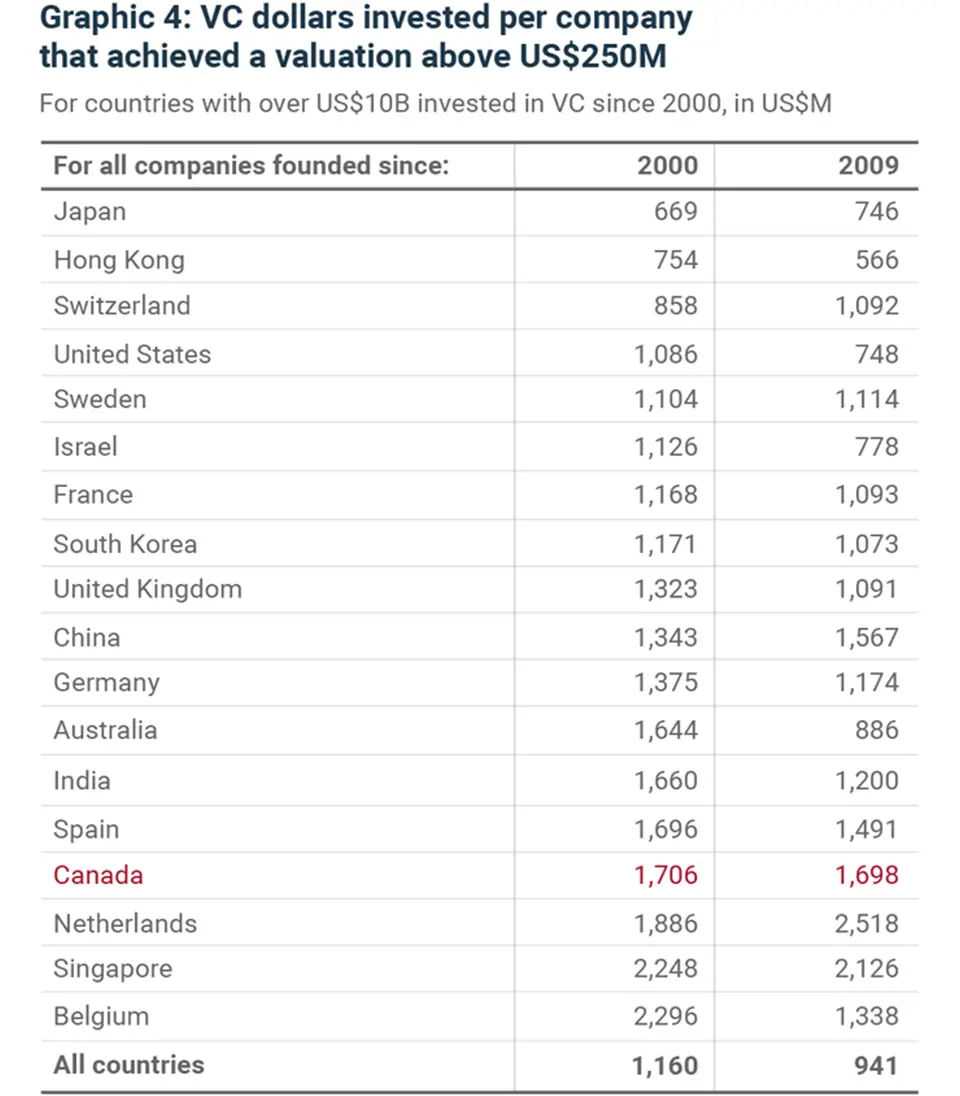
Canada again ranks low on the list. For every success story founded since 2000, US$1.7 billion was pumped into the Canadian ecosystem, compared to US$1 billion in the U.S., US$1.1 billion in Israel and US$1.2 billion in France. In other words, the Canadian ecosystem uses 55% more VC dollars to build a success story than the U.S. ecosystem.
There is clearly an issue. The success rate in Canada is lower than for its peer group, and our ecosystem is relatively inefficient at investing in highly successful companies.
Are large valuations the right benchmark for success?
While Canada does not have a good track record of producing companies with a valuation above US$250M, it may be better at producing smaller exits3 . Graphic 5 compares the proportion of exits greater than US$50M that occurred across valuation ranges for different countries. For example, 20% of U.S.-based exits had a transaction value within the US$50-100M range, 34% within the US$100-$250M range and 45% were above US$250M.
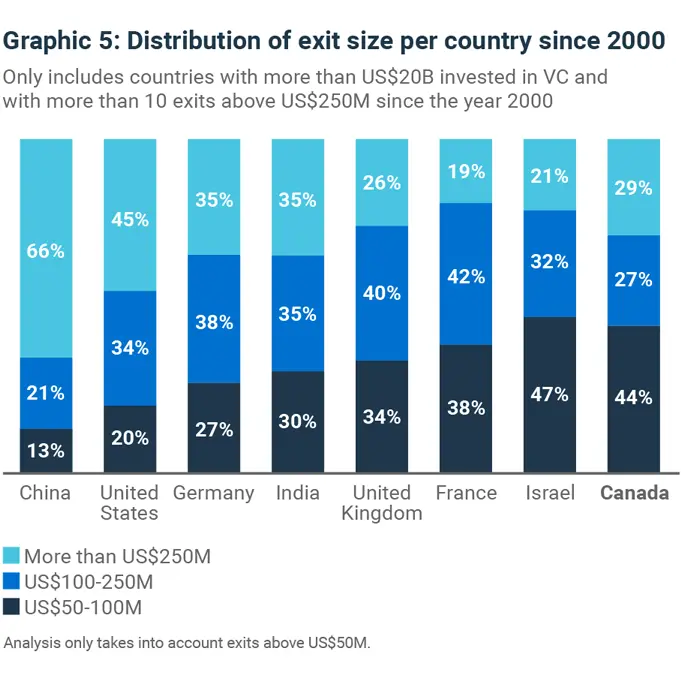
We can see that while the mega-ecosystems of China and U.S. have far more large exits above US$250M, the opposite is true of Canada, where exits are primarily in the US$50-100M range.
While the analysis above considers all VC-backed companies founded over the last 20 years, we repeated the analysis for all companies founded over the last 10 years in Graphic 6. The results of this new analysis suggest an even stronger lean toward the US$50-100M range for Canadian exits.
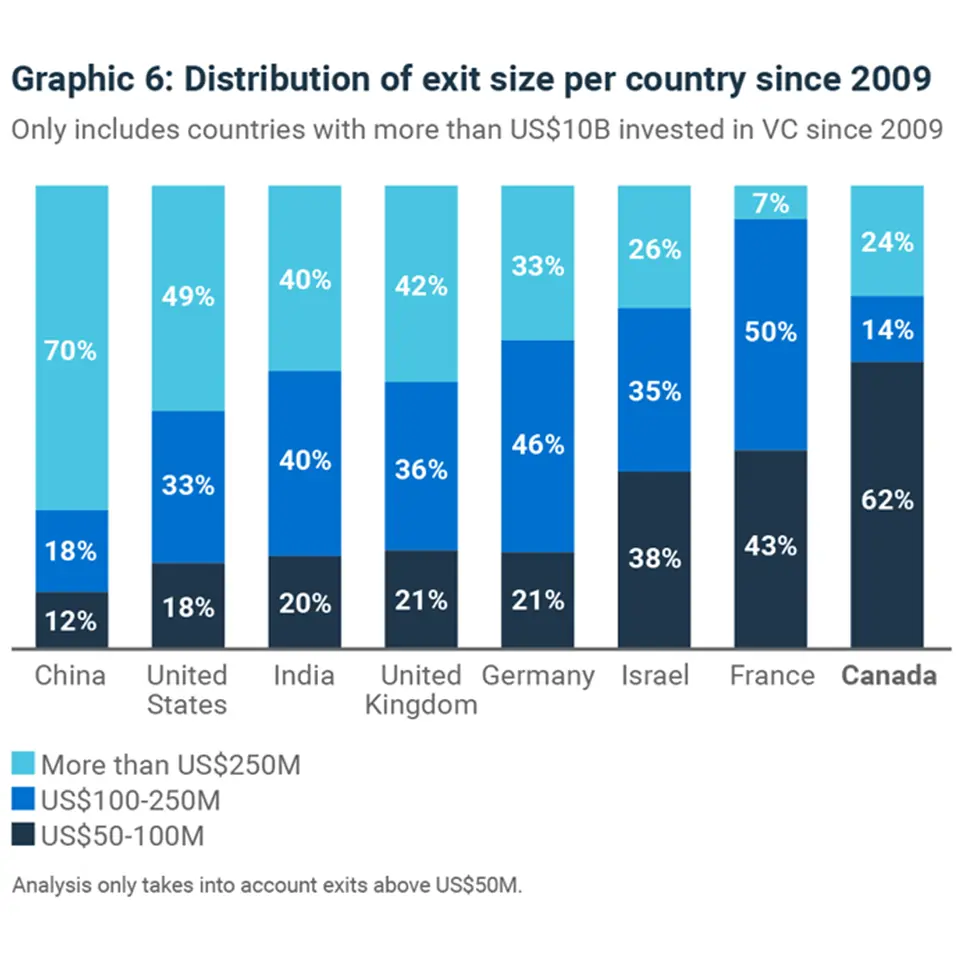
This could lead us to believe that, given the size of our ecosystem, company valuations above US$250M may not be a proper sign of success. How does Canada fare if we adjust our benchmark for success to achieving exits above US$50M?
Canada is a strong creator of smaller exits
As our benchmark for success decreases, Canada seems to perform better when compared with other major ecosystems. With success defined as an exit above US$50M, Canada’s success rate is only two times lower than in the U.S.
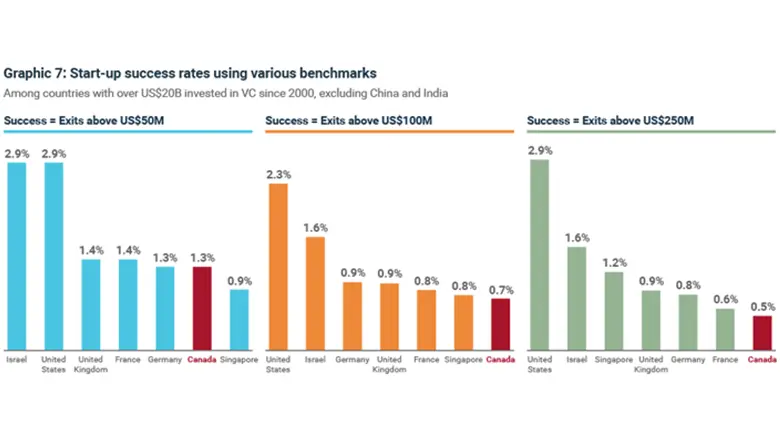
Moreover, the efficiency of our VC ecosystem is suddenly world class. When using a benchmark of exits above US$50M, we are almost 60% more efficient than the U.S. Only Israel and France are more efficient.
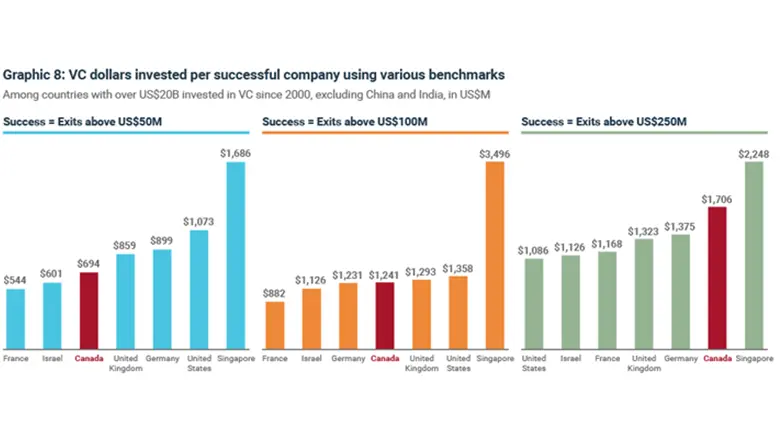
We are well aware that an exit of US$50M is not a successful outcome in many cases, particularly for later stage investors. On the other hand, early stage investors who would be happy with exits of US$50M or more should look closely at sourcing deals in Canada. Their dollars would go a lot further in creating value than they would in the U.S., or almost anywhere else in the world.
That said, we still have an issue: Why do exits in Canada skew so much to the US$50-100M range versus other major ecosystems? And while Israel has a similar skew, it also outperforms Canada by two to three times in the various other metrics we analyzed for this blog. How can we explain this?
We will try to answer this question as well as others in part two of this series.
1. For each of the tables below, there are three things to note: A. We ran each analysis twice: Once for all companies founded since Jan 1, 2000, and then again for all companies founded since Jan 1, 2009. We wanted to make sure that our findings were independent of time horizon. We found no meaningful difference in the results when taking time horizon into account. B. Only companies that were either angel-backed, VC-backed or accelerator-backed at any point during their lifetime were included. Afterall, we are measuring the effectiveness of our venture capital ecosystem, so bootstrapped companies or corporate spinouts should not impact our results. C. All data was taken as of October 2019 2. We define a “success story” as a VC-backed company that has achieved a valuation of at least US$250m. We tested for success stories instead of unicorns (companies with valuations above US$1bn) because the number of unicorns in a market the size of Canada will likely be too small. Any errors in the data would have had a significant impact on our conclusions (i.e. if Canada actually has four unicorns instead of an assumed three, that is a 25% difference in our results). On the other hand, if for any given period of sufficient length Canada has around 20-30 success stories, any error in our data will have less impact on our conclusions. 3. Note the nuance between companies that have yielded a valuation over a certain amount and a company that has exited over a certain amount. Exit amount refers to the amount of capital that a company received through an “exit-type” deal, typically either an IPO or an M&A transaction. A valuation is the value of a company after a financing event. For illustrative purposes, a start-up that was sold to a larger company for $100M is said to have exited for that amount. On the other hand, a start-up raising $10M for 10% equity is said to have raised capital at a valuation of $100M ($10M multiplied by 10).
The data in this blog has been taken directly from Pitchbook, unless stated otherwise. Although we understand that Pitchbook’s data may contain errors, we believe that the results of our analyses should prove directionally relevant and that Pitchbook is the best source we have for finding macro trends in global VC markets.