HASCAP Guarantee statistics by region and sector
Highly Affected Sectors Credit Availability Program (HASCAP) was a financial relief program for entrepreneurs that offered a guarantee on loans of $25,000 to $1 million to cover operational cash flow needs in response to COVID-19. The program ended March 31, 2022.
Loans by province or territory
Total number of loans (#) (cumulative)
17,150
Total loan amount (M $) (cumulative)
$3,713.6
Select a province or territory
Alberta
British Columbia
Prince Edward Island
Manitoba
New Brunswick
Nova Scotia
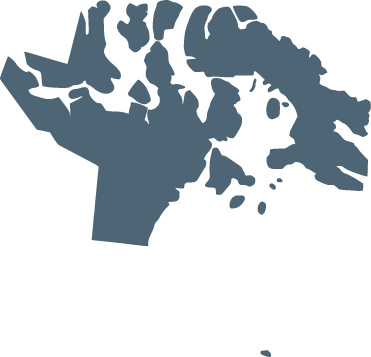
Nunavut
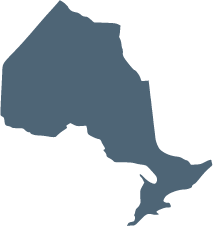
Ontario
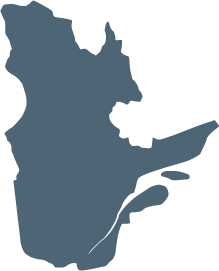
Quebec
Saskatchewan
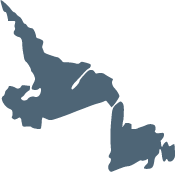
Newfoundland and Labrador
Northwest Territories
Yukon
Other
Number of loans by Province or Territory (#) (cumulative)
2,839
Loan amount by Province or Territory (M $) (cumulative)
$664.0
Loans by Province or Territory (% of total $) (cumulative)
18%
Number of loans by Province or Territory (#) (cumulative)
1,289
Loan amount by Province or Territory (M $) (cumulative)
$303.8
Loans by Province or Territory (% of total $) (cumulative)
8%
Number of loans by Province or Territory (#) (cumulative)
28
Loan amount by Province or Territory (M $) (cumulative)
$9.6
Loans by Province or Territory (% of total $) (cumulative)
0%
Number of loans by Province or Territory (#) (cumulative)
231
Loan amount by Province or Territory (M $) (cumulative)
$61.8
Loans by Province or Territory (% of total $) (cumulative)
2%
Number of loans by Province or Territory (#) (cumulative)
85
Loan amount by Province or Territory (M $) (cumulative)
$20.5
Loans by Province or Territory (% of total $) (cumulative)
1%
Number of loans by Province or Territory (#) (cumulative)
141
Loan amount by Province or Territory (M $) (cumulative)
$31.8
Loans by Province or Territory (% of total $) (cumulative)
1%
Number of loans by Province or Territory (#) (cumulative)
0
Loan amount by Province or Territory (M $) (cumulative)
$0
Loans by Province or Territory (% of total $) (cumulative)
0%
Number of loans by Province or Territory (#) (cumulative)
10,321
Loan amount by Province or Territory (M $) (cumulative)
$2,135.4
Loans by Province or Territory (% of total $) (cumulative)
58%
Number of loans by Province or Territory (#) (cumulative)
1,942
Loan amount by Province or Territory (M $) (cumulative)
$424.4
Loans by Province or Territory (% of total $) (cumulative)
11%
Number of loans by Province or Territory (#) (cumulative)
182
Loan amount by Province or Territory (M $) (cumulative)
$36.4
Loans by Province or Territory (% of total $) (cumulative)
1%
Number of loans by Province or Territory (#) (cumulative)
85
Loan amount by Province or Territory (M $) (cumulative)
$22.8
Loans by Province or Territory (% of total $) (cumulative)
1%
Number of loans by Province or Territory (#) (cumulative)
1
Loan amount by Province or Territory (M $) (cumulative)
$0
Loans by Province or Territory (% of total $) (cumulative)
0%
Number of loans by Province or Territory (#) (cumulative)
3
Loan amount by Province or Territory (M $) (cumulative)
$0.7
Loans by Province or Territory (% of total $) (cumulative)
0%
Number of loans by Province or Territory (#) (cumulative)
3
Loan amount by Province or Territory (M $) (cumulative)
$2.2
Loans by Province or Territory (% of total $) (cumulative)
0%
HASCAP Guarantee – Non-audited data as of July 31, 2022
*For the month of July 2022
Date modified September 28, 2022
Loans by sector
Scroll to the left to view the full table.
(#) (cumulative)
(M $) (cumulative)
(% of total $) (cumulative)
Agriculture, Natural Resources, Manufacturing and Construction Industries
2,367 $578.7 16%
Transportation and Storage
904 $173.9 5%
Transportation (Tourism)
237
$58.0
2%
Wholesale and Retail Trade
2,130 $410.5 11%
Financial and Real Estate Industries
1,180 $235.9 6%
Business, Health and Education Services
2,489 $427.9 12%
Accommodation, food and beverage service industries
4,737 $1,224.5 33%
Eating and Drinking Places (Tourism)
4,003
$913.0
25%
Accommodation Services (Tourism)
648
$293.1
8%
Other Service Industries
3,343 $662.2 18%
Tourism (Recreation, Entertainment and Travel Services)
1,073
$261.2
7%
Total
17,150 $3,713.6 100%